5G Modem WAN Traffic & Throttling Analytics System
Software • Solo Project • February 2026
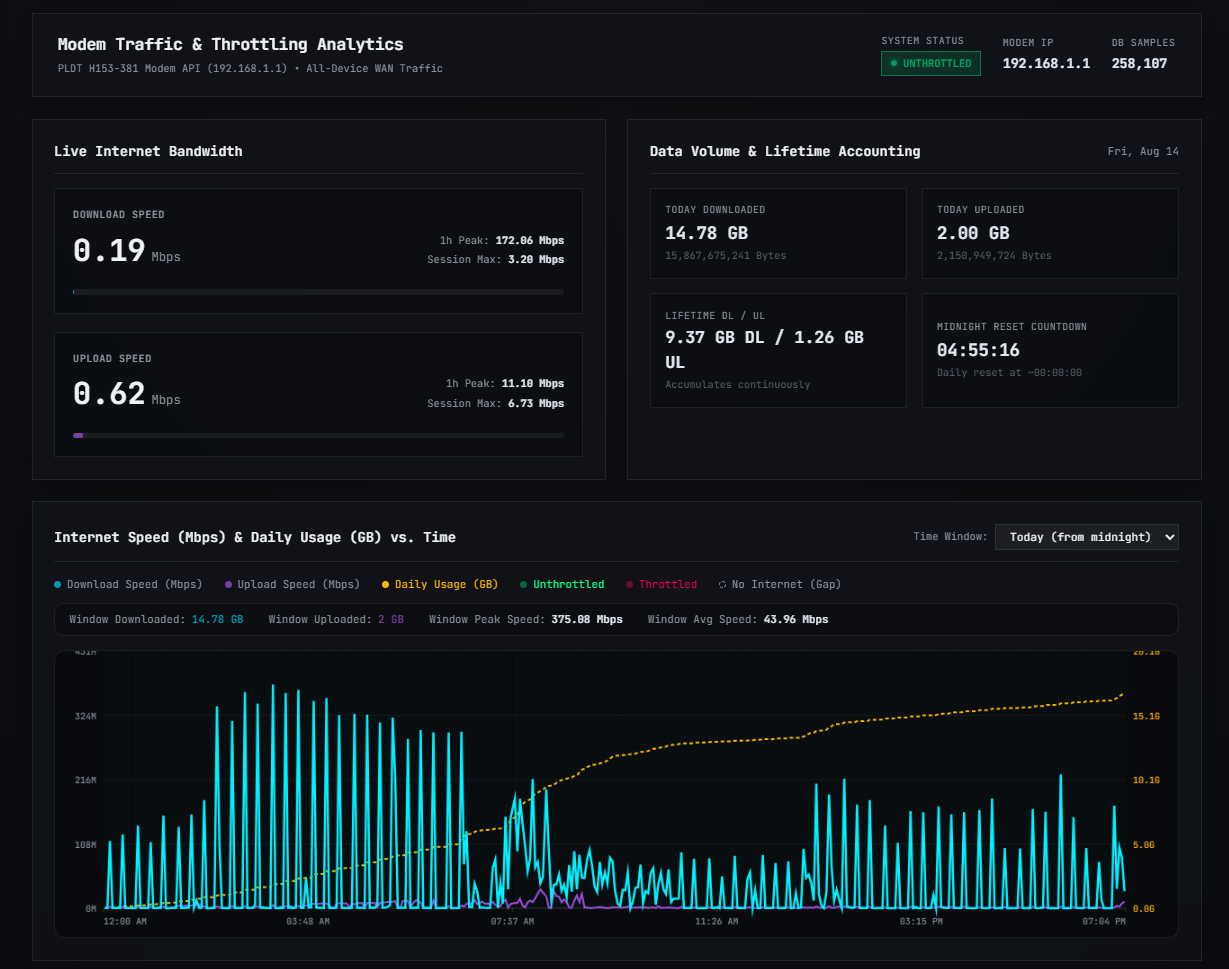
Live real-time web telemetry dashboard featuring a custom monochromatic JetBrains Mono terminal UI, live 2s bandwidth chart, and cellular signal indicators.
Project Overview
I built this system out of pure frustration. I was paying for an "Unlimited" 5G Home WiFi plan, but every single day my connection would suddenly drop to unusable speeds. Whenever I reached out to customer support, they insisted that there was no daily data capping, no speed throttling, and that my connection was completely fine.
Knowing that standard browser speed tests are often misleading or white-listed, I took matters into my own hands. I decided to engineer a 24/7 automated monitoring platform to poll my modem's hardware directly, run scheduled multi-CDN stress benchmarks, and build a tamper-proof repository of empirical data to expose the throttling once and for all.
The Discrepancy & Documented Evidence
When I explicitly asked customer support whether my "Unlimited" promo had a daily cap or if my bandwidth was being throttled under a Fair Usage Policy (FUP), they repeatedly assured me in writing that "promos do not have any daily data capping" and that my connection "will not be slowed down."
Official chat logs with ISP customer support assuring zero daily data caps and claiming speeds are never slowed down.
However, my 24/7 automated telemetry revealed the exact mathematical reality:
- Unthrottled Baseline: When under the daily usage threshold, active stress tests consistently measure ~200–300+ Mbps with 5G NSA signal (5/5 bars).
- Hard Throttled State: The moment the daily threshold is crossed, speeds are forcefully capped at < 5.0–15.0 Mbps — an undeniable 85%–95% performance drop under identical signal strength and cell tower conditions.
Core Architecture
- Direct Huawei Web API Engine poller (captures 100% of network-wide WAN traffic at 2s intervals)
- Layer 2 Bridge Mode and Router Mode compatibility (bypasses router SNMP switch ASIC limitations)
- Multi-CDN active speed probe engine (GitHub Fastly, JetBrains AWS AP, OVH)
- Automated 15-minute scheduled probe loop with live countdown timer
- Double verification threshold logic (< 15.0 Mbps) to eliminate transient false positives
- SQLite time-series database with WAL mode and interactive database reset protection
Development Rundown
To make sure the data was 100% indisputable, I bypassed traditional router SNMP monitoring. In high-speed bridge mode setups, the router's switch ASIC routes packets at Layer 2 without passing them through the CPU, causing SNMP to report only control-plane traffic (~0.05–2 Mbps). By querying the modem's internal Web API directly (at 192.168.1.1), the script captures all WAN bytes across every single connected device.
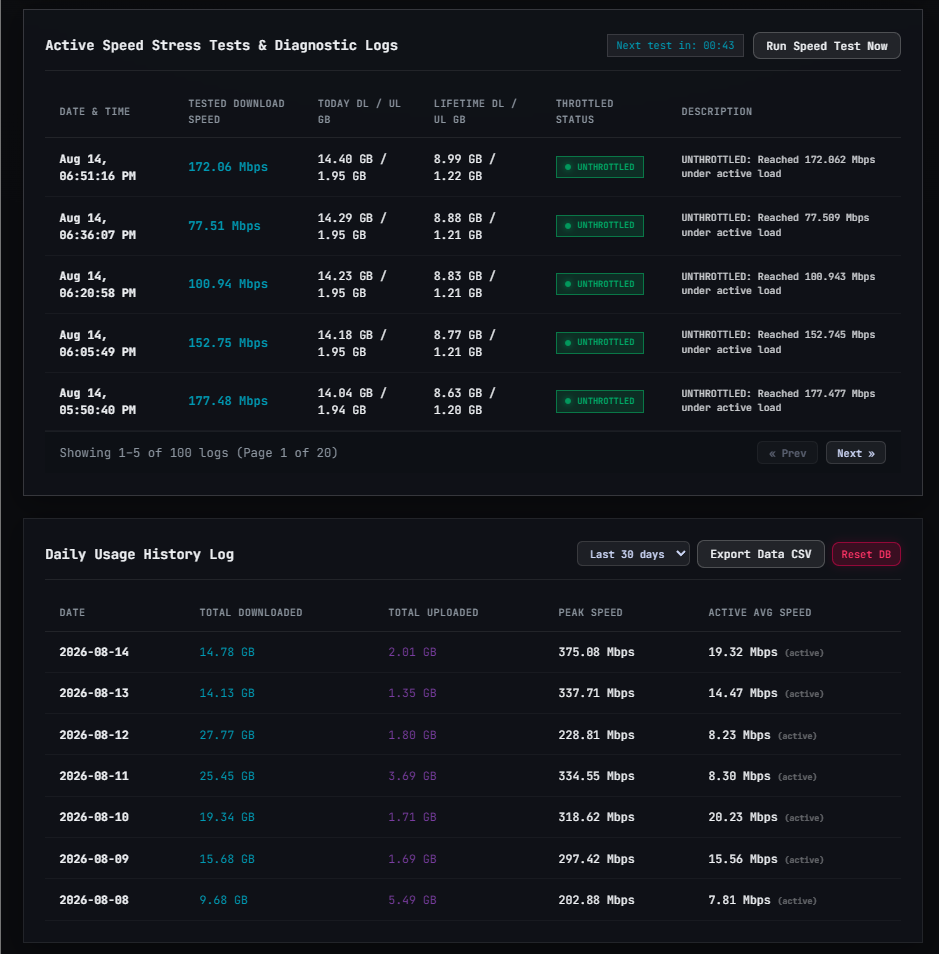
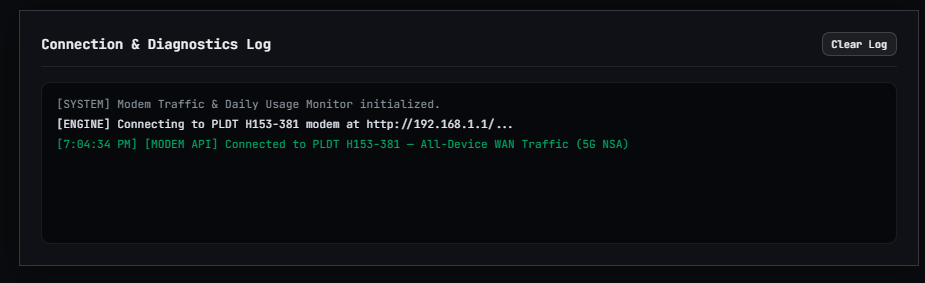
Historical stress test log displaying double-verification status and the live diagnostic polling terminal.
To prove that the slow connection was intentional throttling and not just an idle network, the backend automatically triggers multi-threaded parallel downloads across major global CDN endpoints (GitHub Fastly, JetBrains AWS Asia-Pacific, OVH) every 15 minutes. If an active test drops below 15 Mbps, a secondary probe runs immediately to verify the result.
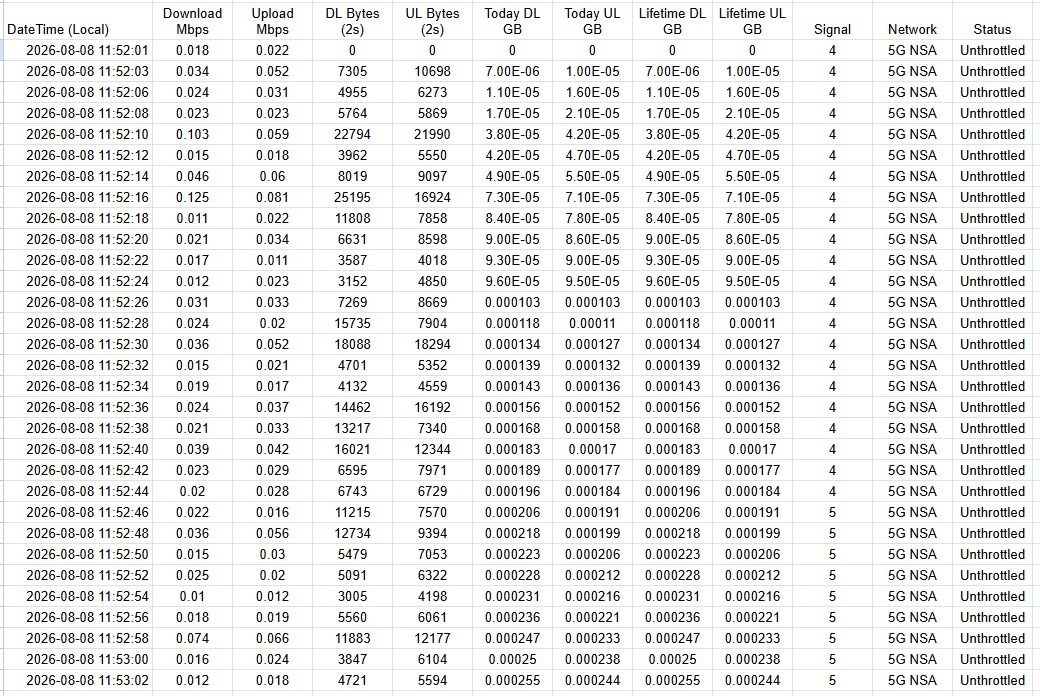
Clean, timestamped CSV spreadsheet export generated from the SQLite database ready for regulatory dispute filing.
All telemetry data is logged into an indexed SQLite database and can be exported as a clean CSV spreadsheet with a single click. Every row is timestamped with local time, bandwidth delta, cumulative GB used, signal quality, and throttling flags—providing bulletproof evidence for regulatory complaints with NTC/DTI.
Challenges & Version 2 Roadmap
Running a continuous 24/7 background telemetry engine required handling modem session timeouts, automatic cookie re-authentication, and preserving byte-delta math across midnight UTC+8 daily resets without cumulative counter drift.
Moving forward, I plan to add automated Discord and Telegram bot webhooks to trigger instant alerts the moment throttling is detected, as well as multi-modem WAN aggregation tracking.